开始使用
步骤 1 — 获取 TradingView Charting Library 访问权限
@iccandle/reactjs-widget 依赖 TradingView Advanced Charts(Charting Library)。请按 TradingView 官方 Get started 申请访问、安装库,并将其作为静态文件托管。
将构建放到应用可加载的路径(例如 Vite 或 Create React App 的 public/charting_library/)。图表库不会打包进 @iccandle/reactjs-widget;运行时通过 widget 选项中的 library_path 加载。
步骤 2 — 安装包
npm install @iccandle/reactjs-widget
# 或
pnpm add @iccandle/reactjs-widget
确保已安装 react 与 react-dom,并满足 peer 版本要求(React 18+)。
步骤 3 — 使用回放辅助函数初始化 TradingView
结果 iframe 的图表回放 / 预测需要配置以下两个辅助函数:
| 辅助函数 | 位置 | 作用 |
|---|---|---|
withPlayChart | datafeed | 包装 subscribeBars,使组件可注入回放 K 线,并在回放期间阻止实时 tick。 |
getCustomIndicators | custom_indicators_getter | 注册 “Generated Candles” 指标,用于绘制预测 OHLC 叠加。 |
getCustomIndicators 的主题("light" / "dark")须与图表主题一致。签名与指标名称见 配置。
import { useEffect, useRef, useState } from "react";
import type {
  ChartingLibraryWidgetOptions,
  IChartingLibraryWidget,
  ResolutionString,
} from "charting_library/charting_library";
import { widget } from "charting_library/charting_library";
import { withPlayChart, getCustomIndicators } from "@iccandle/reactjs-widget";

const LIBRARY_PATH = "/charting_library/";

const containerRef = useRef<HTMLDivElement>(null);
const [chartWidget, setChartWidget] = useState<IChartingLibraryWidget | null>(
  null,
);

useEffect(() => {
  const el = containerRef.current;
  if (!el) return;

  const options: ChartingLibraryWidgetOptions = {
    container: el,
    library_path: LIBRARY_PATH,
    symbol: "EURUSD",
    interval: "60" as ResolutionString,
    datafeed: withPlayChart(yourDatafeed),
    locale: "zh",
    autosize: true,
    drawings_access: {
      type: "black",
      tools: [{ name: "Date Range" }],
    },
    custom_indicators_getter: () => getCustomIndicators("light"),
  };

  const tv = new widget(options);
  setChartWidget(tv);

  return () => {
    try {
      tv.remove();
    } catch {
      /* no-op */
    }
    setChartWidget(null);
  };
}, []);
你必须提供有效的 datafeed、symbol、interval、locale,以及 TradingView 配置与应用所需的其他选项。widget 与类型的导入路径因项目而异 — 请遵循 TradingView 文档。
withPlayChart 也接受工厂函数及其参数:withPlayChart(createDatafeed, arg1, arg2)。
时间轴新闻标记是可选的 — 若需要,请在 yourDatafeed 上实现 getTimescaleMarks(步骤 6)。
若集成仅在 onChartReady 后暴露实例,请在该回调中调用 setChartWidget,而不是在 new widget(...) 后立即调用。
步骤 4 — 用 WidgetIccandle 包裹图表
WidgetIccandle 包裹图表并渲染扫描器浮层。宿主负责结果 iframe:传入 submitCallback 以接收扫描或新闻导航后的嵌入 URL,并用该回调设置 iframe 的 src。当应用已提供导航栏时,建议使用 header=false。
传入 resultIframeRef,以便组件向嵌入端发送 open-pricing 与 chart-resolution。在 iframe 加载时调用 handleResultIframeLoad,以便嵌入端获知父页面 origin。
import { useCallback, useRef, useState } from "react";
import {
  WidgetIccandle,
  handleResultIframeLoad,
  WIDGET_RESULT_URL,
} from "@iccandle/reactjs-widget";

const [iframeSrc, setIframeSrc] = useState(
  `${WIDGET_RESULT_URL}/zh?theme=light&header=false`,
);
const [iframeLoaded, setIframeLoaded] = useState(false);
const resultIframeRef = useRef<HTMLIFrameElement | null>(null);

const submitCallback = useCallback((nextSrc: string) => {
  const url = new URL(nextSrc);
  url.searchParams.set("header", "false");
  setIframeSrc((prev) => (prev === url.toString() ? prev : url.toString()));
}, []);

const handleIframeLoad = useCallback(() => {
  setIframeLoaded(true);
  handleResultIframeLoad(resultIframeRef.current);
}, []);

<>
  <WidgetIccandle
    chartWidget={chartWidget}
    submitCallback={submitCallback}
    theme="light"
    language="zh"
    iframeLoaded={iframeLoaded}
    resultIframeRef={resultIframeRef}
  >
    <div ref={containerRef} style={{ height: "100%", minHeight: 400 }} />
  </WidgetIccandle>
  <iframe
    ref={resultIframeRef}
    src={iframeSrc}
    title="iC Candle results"
    onLoad={handleIframeLoad}
  />
</>
详见 配置 → submitCallback 与 搜索参数 → header。
步骤 5 — 在绘图工具栏中禁用 Date Range
扫描器以编程方式将 TradingView 的 Date Range 形状(date_range)用作 K 线窗口选择器。请在 drawings_access 中将其加入黑名单,避免用户从绘图工具栏再添加一个 Date Range:
drawings_access: {
  type: "black",
  tools: [{ name: "Date Range" }],
},
type: "black" 会隐藏列表中的绘图工具。组件仍会在图表上创建并更新选择器。
默认窗口大小为 25 根 K 线。
步骤 6 — 可选:在 datafeed 上添加新闻标记
日历 / 经济事件标记不是组件内置功能。若要在时间轴上显示它们,请在你自己的 TradingView datafeed(步骤 3 中传给 withPlayChart 的对象)上实现 getTimescaleMarks。同时在 datafeed 的 onReady 配置中设置 supports_timescale_marks: true。
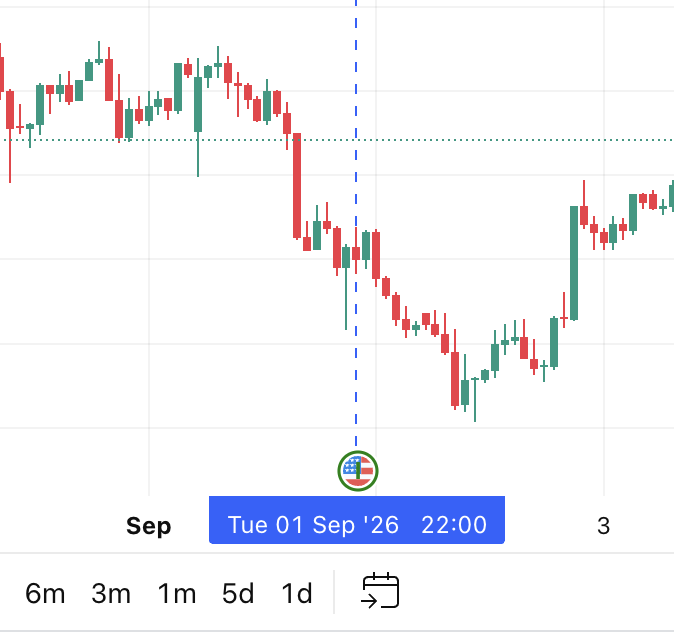
组件将事件存入 localStorage(tv:clicked-news-event、tv:selected-news-events)。你的 datafeed 应读取这些键并返回 TradingView 标记。完整示例见 可选:时间轴标记。
getTimescaleMarks: async (
  _symbolInfo: LibrarySymbolInfo,
  _from: number,
  _to: number,
  onResult: GetMarksCallback<TimescaleMark>,
) => {
  const marks: TimescaleMark[] = [];

  const pushEventMark = (
    event: NewsEventType,
    options?: { color?: TimescaleMark["color"]; richTooltip?: boolean },
  ) => {
    const { id, timestamp, event_name, currency, actual, forecast, previous } =
      event;
    if (!id || !Number.isFinite(timestamp) || timestamp <= 0) return;
    if (marks.some((m) => String(m.id) === String(id))) return;

    const tooltip = options?.richTooltip
      ? [
          event_name,
          currency ? `Currency: ${currency}` : null,
          actual ? `Actual: ${actual}` : null,
          forecast ? `Forecast: ${forecast}` : null,
          previous ? `Previous: ${previous}` : null,
        ].filter((line): line is string => Boolean(line))
      : [event_name];

    marks.push({
      id,
      time: timestamp / 1000,
      color: options?.color ?? "green",
      label: event_name.slice(0, 1) || "N",
      tooltip,
      ...(currency
        ? { imageUrl: `https://cdn.backprop.services/symbols/${currency}.svg` }
        : {}),
      showLabelWhenImageLoaded: true,
    });
  };

  try {
    const clickedEvent = JSON.parse(
      localStorage.getItem("tv:clicked-news-event") || "null",
    ) as NewsEventType | null;
    if (clickedEvent) {
      pushEventMark(clickedEvent, { color: "blue", richTooltip: true });
    }
  } catch {
    // no-op
  }

  try {
    const allNewsEvents = JSON.parse(
      localStorage.getItem("tv:selected-news-events") || "[]",
    ) as NewsEventType[];
    allNewsEvents?.forEach((event) => pushEventMark(event));
  } catch {
    // no-op
  }

  onResult(marks);
},
NewsEventType 与 NewsEvent 一致。从你的 Charting Library 类型中导入 LibrarySymbolInfo、GetMarksCallback 与 TimescaleMark。
认证
用户通过嵌入式结果应用登录。成功后,嵌入端发送 auth.signIn,组件将 data.idToken 作为 iccandle_token 写入 localStorage。扫描缓存与形态追踪 API 使用该令牌作为 Bearer 凭证。auth.signOut 会清除该令牌。
无需向 WidgetIccandle 传入 API 密钥 prop — 认证由 iframe 登录流程处理。必须在 iframe 加载时调用 handleResultIframeLoad,以便在登录前(重试)发送 parent-origin;否则令牌可能无法落地。
企业合作伙伴:见 无缝认证示例。
主题与语言
theme="light"/theme="dark"— 强制扫描器与 iframe 使用对应配色。theme="system"— 跟随prefers-color-scheme。language— 可选en、zh、vi、th、ko、ja、mn、ru(默认en)。应用于扫描器 UI 与结果 iframe 语言。chartMaskColors— 回放时用于隐藏尚未揭示的预测 K 线的面板匹配色。默认{ light: "#ffffff", dark: "#0F0F0F" }。若 TradingView 图表面板背景不同,请传入对应的十六进制颜色(见 chartMaskColors)。bg_dark/bg_light— 各主题下结果 iframe 的十六进制页面背景(#可选)。组件会把它们追加到扫描、新闻与定价 URL 上。请在初始 iframesrc上带上相同值,使首次加载一致(见 bg_dark 与 bg_light)。
完整示例
import { useCallback, useEffect, useRef, useState } from "react";
import type {
  ChartingLibraryWidgetOptions,
  IChartingLibraryWidget,
  ResolutionString,
} from "charting_library/charting_library";
import { widget } from "charting_library/charting_library";
import {
  WidgetIccandle,
  withPlayChart,
  getCustomIndicators,
  handleResultIframeLoad,
  WIDGET_RESULT_URL,
} from "@iccandle/reactjs-widget";

const LIBRARY_PATH = "/charting_library/";

export function ChartWithIccandle() {
  const containerRef = useRef<HTMLDivElement>(null);
  const resultIframeRef = useRef<HTMLIFrameElement | null>(null);
  const [chartWidget, setChartWidget] = useState<IChartingLibraryWidget | null>(
    null,
  );
  const [iframeSrc, setIframeSrc] = useState(
    `${WIDGET_RESULT_URL}/zh?theme=light&header=false&bg_dark=0F0F0F&bg_light=ffffff`,
  );
  const [iframeLoaded, setIframeLoaded] = useState(false);

  const submitCallback = useCallback((nextSrc: string) => {
    const url = new URL(nextSrc);
    url.searchParams.set("header", "false");
    setIframeSrc((prev) => (prev === url.toString() ? prev : url.toString()));
  }, []);

  const handleIframeLoad = useCallback(() => {
    setIframeLoaded(true);
    handleResultIframeLoad(resultIframeRef.current);
  }, []);

  return (
    <div className="iccandle-selector-widget__container">
      <div className="iccandle-selector-widget__chart-pane">
        <WidgetIccandle
          chartWidget={chartWidget}
          submitCallback={submitCallback}
          theme="light"
          language="zh"
          iframeLoaded={iframeLoaded}
          resultIframeRef={resultIframeRef}
          chartMaskColors={{ light: "#ffffff", dark: "#0F0F0F" }}
          bg_dark="#0F0F0F"
          bg_light="#ffffff"
          availableIntervals={["1", "5", "15", "30", "60"]}
          onCloseResult={() => {
            /* 可选:嵌入端发送 selector.closeResult 时处理 */
          }}
        >
          <ChartHost
            containerRef={containerRef}
            onReady={setChartWidget}
          />
        </WidgetIccandle>
      </div>
      <iframe
        ref={resultIframeRef}
        src={iframeSrc}
        className="iccandle-selector-widget__iframe"
        title="iC Candle results"
        onLoad={handleIframeLoad}
      />
    </div>
  );
}

function ChartHost({
  containerRef,
  onReady,
}: {
  containerRef: React.RefObject<HTMLDivElement | null>;
  onReady: (w: IChartingLibraryWidget | null) => void;
}) {
  useEffect(() => {
    const el = containerRef.current;
    if (!el) return;

    const options: ChartingLibraryWidgetOptions = {
      container: el,
      library_path: LIBRARY_PATH,
      symbol: "EURUSD",
      interval: "60" as ResolutionString,
      datafeed: withPlayChart(yourDatafeed),
      locale: "zh",
      autosize: true,
      drawings_access: {
        type: "black",
        tools: [{ name: "Date Range" }],
      },
      custom_indicators_getter: () => getCustomIndicators("light"),
    };

    const tv = new widget(options);
    onReady(tv);

    return () => {
      try {
        tv.remove();
      } catch {
        /* no-op */
      }
      onReady(null);
    };
  }, [containerRef, onReady]);

  return <div ref={containerRef} style={{ height: "100%", width: "100%" }} />;
}
将 yourDatafeed 与 widget 选项替换为你的真实 datafeed 与 TradingView 配置。
功能概览
形态扫描器
- 订阅图表就绪、品种、周期与绘图事件。
- 管理
date_range多点绘图以选择 K 线窗口。 - 扫描时:将 K 线提交到缓存服务,再通过
submitCallback传入带搜索参数的嵌入 URL(symbol、res、ref_res、cid、tk、from、to,以及可选的fs/period/model/temp、theme,以及已设置时的bg_dark/bg_light)。 - 可选高级筛选(品种、top-k、回看周期、AI 模型、温度)保存在
localStorage的search-filter下(用户不持久化时保存在sessionStorage的search-filter-session)。
结果 iframe
- 宿主持有 iframe;初始
src通常为${WIDGET_RESULT_URL}/{language}?theme=…&header=false,设置嵌入页背景时再加上bg_dark/bg_light。 - 扫描 / 新闻导航后,
submitCallback会收到下一个 URL — 据此设置 iframesrc(如需隐藏顶栏请重新加上header=false)。 - iframe 加载后,调用
handleResultIframeLoad(iframe),父页面会(重试)发送{ type: "parent-origin", origin },并在 Stripe 返回后发送{ type: "payment-success" }。
形态追踪
用户可从扫描器弹窗打开订阅模态框,追踪自定义形态(名称 + 周期 + 品种)。需要有效的 iccandle_token。若不需要该操作,可传 isShowTrackerButton={false}。
新闻 / 经济事件
- 点击时间轴标记可打开事件信息模态框(货币日历事件;跳过假期 / early / 纯情绪标记)。
- 「查看详情」在 iframe 中加载相似事件,并在图表上绘制垂直线。
- 若 datafeed 实现了
getTimescaleMarks,可通过localStorage键tv:selected-news-events与tv:clicked-news-event驱动标记 — 详见 步骤 6 与 可选:时间轴标记。
常见模式
| 模式 | 做法 |
|---|---|
| 全页图表 + 结果 | 使用打包注入的分栏类:.iccandle-selector-widget__container、__chart-pane、__iframe(小于 1024px 时纵向堆叠)。 |
| 主题同步 | 从应用壳传入 theme(light / dark / system)。将 chartMaskColors 与 paneProperties.background 对齐。 |
| 嵌入页背景 | 传入 bg_dark 与 bg_light,并在初始 iframe src 上带上相同的十六进制颜色。 |
| 语言同步 | 传入 language 以匹配应用语言。 |
| 隐藏嵌入顶栏 | 在初始 iframe URL 与 submitCallback 内追加 header=false。 |
| 等 iframe 就绪再扫描 | 结果 iframe 加载完成后传 iframeLoaded={true}(若不需要门控可省略该 prop)。 |
| 隐藏扫描 / 追踪 | isShowScanButton={false} / isShowTrackerButton={false} / isShowScannerPopup={false}。 |
| 时间轴新闻标记 | 可选:在你的 datafeed 上实现 getTimescaleMarks — 见 步骤 6。 |