Get started
Step 1 — Get TradingView Charting Library access
@iccandle/reactjs-widget requires TradingView Advanced Charts (Charting Library). Request access, install the library, and host it as static files by following TradingView’s Get started guide.
Serve the build from a path your app can load (e.g. public/charting_library/ in Vite or Create React App). The library is not bundled inside @iccandle/reactjs-widget; it loads at runtime via library_path on the widget options.
Step 2 — Install the package
npm install @iccandle/reactjs-widget
# or
pnpm add @iccandle/reactjs-widget
Ensure react and react-dom are installed and meet the peer version range (React 18+).
Step 3 — Bootstrap TradingView with replay helpers
Two helpers are required for chart replay / predict from the results iframe:
| Helper | Where | Purpose |
|---|---|---|
withPlayChart | datafeed | Wraps subscribeBars so the widget can inject replay bars and block live ticks during playback. |
getCustomIndicators | custom_indicators_getter | Registers the “Generated Candles” studies that draw predicted OHLC overlays. |
Pass the same theme ("light" or "dark") to getCustomIndicators as your chart uses. See Configuration for signatures and study names.
import { useEffect, useRef, useState } from "react";
import type {
  ChartingLibraryWidgetOptions,
  IChartingLibraryWidget,
  ResolutionString,
} from "charting_library/charting_library";
import { widget } from "charting_library/charting_library";
import { withPlayChart, getCustomIndicators } from "@iccandle/reactjs-widget";

const LIBRARY_PATH = "/charting_library/";

const containerRef = useRef<HTMLDivElement>(null);
const [chartWidget, setChartWidget] = useState<IChartingLibraryWidget | null>(
  null,
);

useEffect(() => {
  const el = containerRef.current;
  if (!el) return;

  const options: ChartingLibraryWidgetOptions = {
    container: el,
    library_path: LIBRARY_PATH,
    symbol: "EURUSD",
    interval: "60" as ResolutionString,
    datafeed: withPlayChart(yourDatafeed),
    locale: "en",
    autosize: true,
    drawings_access: {
      type: "black",
      tools: [{ name: "Date Range" }],
    },
    custom_indicators_getter: () => getCustomIndicators("light"),
  };

  const tv = new widget(options);
  setChartWidget(tv);

  return () => {
    try {
      tv.remove();
    } catch {
      /* no-op */
    }
    setChartWidget(null);
  };
}, []);
You must supply a valid datafeed, symbol, interval, locale, and any other options required by your TradingView setup and app. Import paths for widget and types differ by setup — follow TradingView’s docs for your bundler.
withPlayChart also accepts a factory plus its arguments: withPlayChart(createDatafeed, arg1, arg2).
News marks on the time axis are optional — add getTimescaleMarks on yourDatafeed if you want them (Step 6).
If your integration only exposes the instance after onChartReady, call setChartWidget inside that callback instead of immediately after new widget(...).
Step 4 — Wrap the chart with WidgetIccandle
WidgetIccandle wraps your chart and renders the scanner overlay. The host owns the results iframe: pass submitCallback to receive embed URLs after a scan or news navigation, and set your iframe src from that callback. Prefer header=false when your app already provides navigation chrome.
Pass resultIframeRef so the widget can post open-pricing and chart-resolution to the embed. On iframe load, call handleResultIframeLoad so the embed knows the parent origin.
import { useCallback, useRef, useState } from "react";
import {
  WidgetIccandle,
  handleResultIframeLoad,
  WIDGET_RESULT_URL,
} from "@iccandle/reactjs-widget";

const [iframeSrc, setIframeSrc] = useState(
  `${WIDGET_RESULT_URL}/en?theme=light&header=false`,
);
const [iframeLoaded, setIframeLoaded] = useState(false);
const resultIframeRef = useRef<HTMLIFrameElement | null>(null);

const submitCallback = useCallback((nextSrc: string) => {
  const url = new URL(nextSrc);
  url.searchParams.set("header", "false");
  setIframeSrc((prev) => (prev === url.toString() ? prev : url.toString()));
}, []);

const handleIframeLoad = useCallback(() => {
  setIframeLoaded(true);
  handleResultIframeLoad(resultIframeRef.current);
}, []);

<>
  <WidgetIccandle
    chartWidget={chartWidget}
    submitCallback={submitCallback}
    theme="light"
    language="en"
    iframeLoaded={iframeLoaded}
    resultIframeRef={resultIframeRef}
  >
    <div ref={containerRef} style={{ height: "100%", minHeight: 400 }} />
  </WidgetIccandle>
  <iframe
    ref={resultIframeRef}
    src={iframeSrc}
    title="iC Candle results"
    onLoad={handleIframeLoad}
  />
</>
See Configuration → submitCallback and Search params → header.
Step 5 — Disable Date Range in the drawing toolbar
The scanner uses TradingView’s Date Range shape (date_range) programmatically as the bar-window selector. Blacklist it in drawings_access so users cannot add a second Date Range from the drawings toolbar:
drawings_access: {
  type: "black",
  tools: [{ name: "Date Range" }],
},
With type: "black", listed tools are hidden from the drawing UI. The widget still creates and updates the selector on the chart.
Default window size is 25 bars.
Step 6 — Optional: news marks on the datafeed
Calendar / economic event marks are not built into the widget. If you want them on the time axis, add getTimescaleMarks to your TradingView datafeed (the object you pass to withPlayChart in step 3). Also set supports_timescale_marks: true in the datafeed onReady configuration.
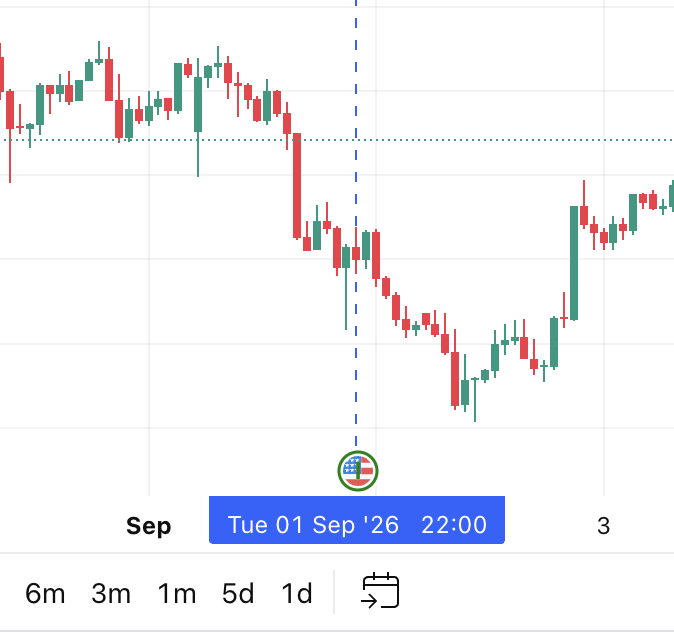
The widget stores events in localStorage (tv:clicked-news-event, tv:selected-news-events). Your datafeed should read those keys and return TradingView marks. Full example: Optional: timescale marks.
getTimescaleMarks: async (
  _symbolInfo: LibrarySymbolInfo,
  _from: number,
  _to: number,
  onResult: GetMarksCallback<TimescaleMark>,
) => {
  const marks: TimescaleMark[] = [];

  const pushEventMark = (
    event: NewsEventType,
    options?: { color?: TimescaleMark["color"]; richTooltip?: boolean },
  ) => {
    const { id, timestamp, event_name, currency, actual, forecast, previous } =
      event;
    if (!id || !Number.isFinite(timestamp) || timestamp <= 0) return;
    if (marks.some((m) => String(m.id) === String(id))) return;

    const tooltip = options?.richTooltip
      ? [
          event_name,
          currency ? `Currency: ${currency}` : null,
          actual ? `Actual: ${actual}` : null,
          forecast ? `Forecast: ${forecast}` : null,
          previous ? `Previous: ${previous}` : null,
        ].filter((line): line is string => Boolean(line))
      : [event_name];

    marks.push({
      id,
      time: timestamp / 1000,
      color: options?.color ?? "green",
      label: event_name.slice(0, 1) || "N",
      tooltip,
      ...(currency
        ? { imageUrl: `https://cdn.backprop.services/symbols/${currency}.svg` }
        : {}),
      showLabelWhenImageLoaded: true,
    });
  };

  try {
    const clickedEvent = JSON.parse(
      localStorage.getItem("tv:clicked-news-event") || "null",
    ) as NewsEventType | null;
    if (clickedEvent) {
      pushEventMark(clickedEvent, { color: "blue", richTooltip: true });
    }
  } catch {
    // no-op
  }

  try {
    const allNewsEvents = JSON.parse(
      localStorage.getItem("tv:selected-news-events") || "[]",
    ) as NewsEventType[];
    allNewsEvents?.forEach((event) => pushEventMark(event));
  } catch {
    // no-op
  }

  onResult(marks);
},
NewsEventType matches NewsEvent. Import LibrarySymbolInfo, GetMarksCallback, and TimescaleMark from your Charting Library typings.
Auth
Users sign in through the embedded results app. On success, the embed posts auth.signIn and the widget stores data.idToken as iccandle_token in localStorage. Scan cache and pattern tracker APIs use that token as a Bearer credential. auth.signOut clears the token.
You do not pass an API key prop to WidgetIccandle — auth is handled via the iframe login flow. handleResultIframeLoad must run on iframe load so parent-origin is posted (retried) before sign-in; otherwise the token may never land.
Corporate partners: see Seamless auth example.
Theme and language
theme="light"/theme="dark"— forces that palette for scanner chrome and the iframe.theme="system"— followsprefers-color-scheme.language— one ofen,zh,vi,th,ko,ja,mn,ru(defaults toen). Applied to scanner UI and the results iframe locale.chartMaskColors— pane-matching color used to hide unrevealed predicted candles during replay. Defaults{ light: "#ffffff", dark: "#0F0F0F" }. If your TradingView pane background differs, pass the matching hex (see chartMaskColors).bg_dark/bg_light— hex page background for the results iframe in each theme (#optional). The widget appends them on scan, news, and pricing URLs. Put the same values on the initial iframesrcso the first load matches (see bg_dark and bg_light).
Full working example
import { useCallback, useEffect, useRef, useState } from "react";
import type {
  ChartingLibraryWidgetOptions,
  IChartingLibraryWidget,
  ResolutionString,
} from "charting_library/charting_library";
import { widget } from "charting_library/charting_library";
import {
  WidgetIccandle,
  withPlayChart,
  getCustomIndicators,
  handleResultIframeLoad,
  WIDGET_RESULT_URL,
} from "@iccandle/reactjs-widget";

const LIBRARY_PATH = "/charting_library/";

export function ChartWithIccandle() {
  const containerRef = useRef<HTMLDivElement>(null);
  const resultIframeRef = useRef<HTMLIFrameElement | null>(null);
  const [chartWidget, setChartWidget] = useState<IChartingLibraryWidget | null>(
    null,
  );
  const [iframeSrc, setIframeSrc] = useState(
    `${WIDGET_RESULT_URL}/en?theme=light&header=false&bg_dark=0F0F0F&bg_light=ffffff`,
  );
  const [iframeLoaded, setIframeLoaded] = useState(false);

  const submitCallback = useCallback((nextSrc: string) => {
    const url = new URL(nextSrc);
    url.searchParams.set("header", "false");
    setIframeSrc((prev) => (prev === url.toString() ? prev : url.toString()));
  }, []);

  const handleIframeLoad = useCallback(() => {
    setIframeLoaded(true);
    handleResultIframeLoad(resultIframeRef.current);
  }, []);

  return (
    <div className="iccandle-selector-widget__container">
      <div className="iccandle-selector-widget__chart-pane">
        <WidgetIccandle
          chartWidget={chartWidget}
          submitCallback={submitCallback}
          theme="light"
          language="en"
          iframeLoaded={iframeLoaded}
          resultIframeRef={resultIframeRef}
          chartMaskColors={{ light: "#ffffff", dark: "#0F0F0F" }}
          bg_dark="#0F0F0F"
          bg_light="#ffffff"
          availableIntervals={["1", "5", "15", "30", "60"]}
          onCloseResult={() => {
            /* optional: react when the embed posts selector.closeResult */
          }}
        >
          <ChartHost
            containerRef={containerRef}
            onReady={setChartWidget}
          />
        </WidgetIccandle>
      </div>
      <iframe
        ref={resultIframeRef}
        src={iframeSrc}
        className="iccandle-selector-widget__iframe"
        title="iC Candle results"
        onLoad={handleIframeLoad}
      />
    </div>
  );
}

function ChartHost({
  containerRef,
  onReady,
}: {
  containerRef: React.RefObject<HTMLDivElement | null>;
  onReady: (w: IChartingLibraryWidget | null) => void;
}) {
  useEffect(() => {
    const el = containerRef.current;
    if (!el) return;

    const options: ChartingLibraryWidgetOptions = {
      container: el,
      library_path: LIBRARY_PATH,
      symbol: "EURUSD",
      interval: "60" as ResolutionString,
      datafeed: withPlayChart(yourDatafeed),
      locale: "en",
      autosize: true,
      drawings_access: {
        type: "black",
        tools: [{ name: "Date Range" }],
      },
      custom_indicators_getter: () => getCustomIndicators("light"),
    };

    const tv = new widget(options);
    onReady(tv);

    return () => {
      try {
        tv.remove();
      } catch {
        /* no-op */
      }
      onReady(null);
    };
  }, [containerRef, onReady]);

  return <div ref={containerRef} style={{ height: "100%", width: "100%" }} />;
}
Replace yourDatafeed and widget options with your real datafeed and TradingView settings.
Features overview
Pattern scanner
- Subscribes to chart readiness, symbol, resolution, and drawing events.
- Manages a
date_rangemultipoint drawing for the bar window. - On scan: posts candles to the cache service, then calls
submitCallbackwith search parameters in the embed URL (symbol,res,ref_res,cid,tk,from,to, optionalfs/period/model/temp,theme, andbg_dark/bg_lightwhen set). - Optional advanced filters (symbols, top-k, lookback period, AI model, temperature) stored in
localStorageundersearch-filter(orsessionStorageundersearch-filter-sessionwhen the user does not persist them).
Results iframe
- Host owns the iframe; initial
srcis typically${WIDGET_RESULT_URL}/{language}?theme=…&header=false, plusbg_dark/bg_lightwhen you set an embed page background. - After scan / news navigation,
submitCallbackreceives the next URL — set iframesrcfrom it (re-applyheader=falseif needed). - On iframe load, call
handleResultIframeLoad(iframe)so the parent posts{ type: "parent-origin", origin }(retried) and, after Stripe return,{ type: "payment-success" }.
Pattern tracker
From the scanner popup, users can open a subscription modal to track a custom pattern (name + timeframes + symbols). Requires a valid iccandle_token. Hide the action with isShowTrackerButton={false} if you do not want it.
News / economic events
- Clicking a timescale mark can open an event info modal (currency calendar events; skips holidays / early / sentiment-only marks).
- “Go to detail” loads similar events in the iframe and draws a vertical line on the chart.
- Marks can be driven from
localStoragekeystv:selected-news-eventsandtv:clicked-news-eventif your datafeed implementsgetTimescaleMarks— see Step 6 and Optional: timescale marks.
Common patterns
| Pattern | Approach |
|---|---|
| Full-page chart + results | Use injected split-pane classes: .iccandle-selector-widget__container, __chart-pane, __iframe (stacks below 1024px). |
| Theme sync | Pass theme from your app shell (light / dark / system). Match chartMaskColors to paneProperties.background. |
| Embed page background | Pass bg_dark and bg_light, and include the same hex on the initial iframe src. |
| Locale sync | Pass language to match your app locale. |
| Hide embed header | Append header=false on the initial iframe URL and inside submitCallback. |
| Gate scans until iframe ready | Pass iframeLoaded={true} once the results iframe has loaded (or omit the prop if you do not gate). |
| Hide Scan / Tracker | isShowScanButton={false} / isShowTrackerButton={false} / isShowScannerPopup={false}. |
| News marks on the time axis | Optional: implement getTimescaleMarks on your datafeed — see Step 6. |