Client / Broker Statistics
Platforms and clients review credit usage and user activity from two complementary surfaces: the platform admin dashboard and the client's Organization Users embed.
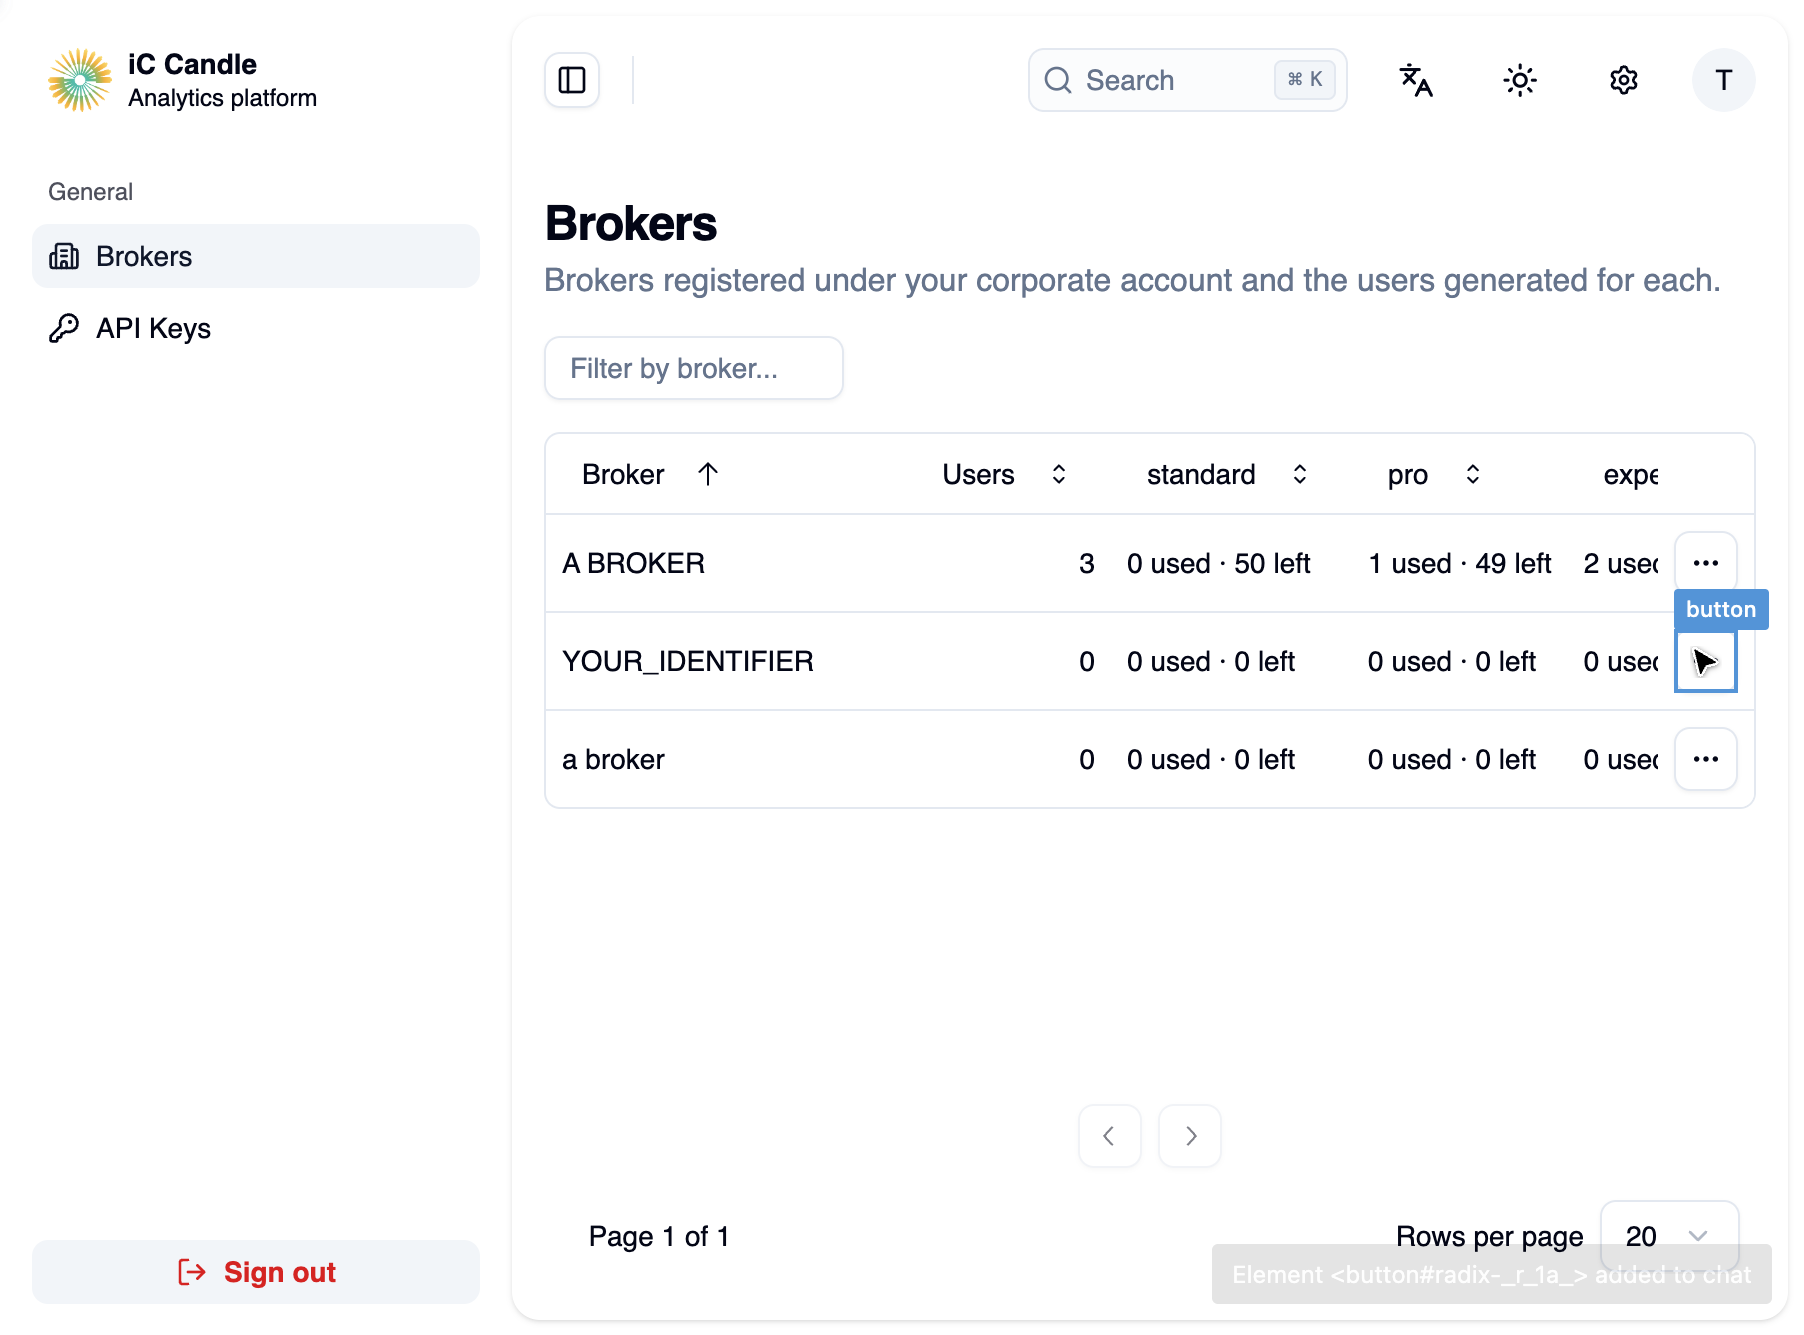
Where to look
| View | Who | What it shows |
|---|---|---|
| Client / broker list + plan bundle | Platform (admin dashboard) | Remaining / used credits per client, top-up history |
| Credit bundle cards | Client (Organization Users embed) | Live credits left / granted per tier |
| Users table | Client (Organization Users embed) | End users, plans, created / updated dates |
| Request analytics (if enabled) | Platform (admin dashboard) | API call volume by client and endpoint |
Credit bundle metrics
Visible to the client at https://manage.iccandle.site/ under Credit bundle:
| Metric | Meaning |
|---|---|
| N left | Credits still available to assign on that tier |
| X of Y granted | Credits already assigned vs total for that tier |
| TOTAL | Combined left / granted across tiers |
| Progress % | Share of the tier that is granted |
Caption example: 12 of 50 credits assigned to your users.
Platforms set the totals via Top Up Clients. Clients only consume credits by assigning plans in the embed.
User activity in the Organization Users panel
| Field | Meaning |
|---|---|
| User | Name and email |
| User ID | Stable user identifier |
| Plan | Current plan (Standard, Pro, Expert, or No plan) |
| Created | Account created date (YYYY-MM-DD) |
| Updated | Last update date (YYYY-MM-DD) |
Use Search your users, the plan filter, and column sorting to focus on a subset. Select a user to open the detail drawer and see Current plan, Last active (when available), and credits left per tier before assigning.
Platform-side transaction history
In the admin dashboard, expand a client / broker row (where supported) to load Bundle transactions:
| Column | Description |
|---|---|
| Date | When the top-up occurred |
| standard / pro / expert | Credits added in that tier |
| Total | Sum of credits in the transaction |
Use this to reconcile platform top-ups against what the client still has left in the embed.
Request Analytics (admin)
If your admin dashboard includes Request Analytics:
| Control | Purpose |
|---|---|
| Date range / presets | Last 7 / 30 / 90 days or custom From / To |
| Client | Filter by client identifier |
| Endpoint | Filter by API path |
Summary cards typically include Total requests, Unique clients, Unique endpoints, and Avg. per day, plus daily charts and client × endpoint breakdowns.
Confirm with iC Candle whether your platform account has Request Analytics enabled and which client identifiers map to your brokers.
Metric reference
| Metric | Surface | How to read it |
|---|---|---|
| Credits left | Embed Credit bundle | Capacity still available to assign |
| Credits granted | Embed Credit bundle | Capacity already used by end-user plans |
| Plans per user | Embed users table / drawer | Current entitlement |
| Top-up total | Admin bundle transactions | Credits the platform added |
| API requests | Admin Request Analytics | Traffic volume for a date range |